
Blog
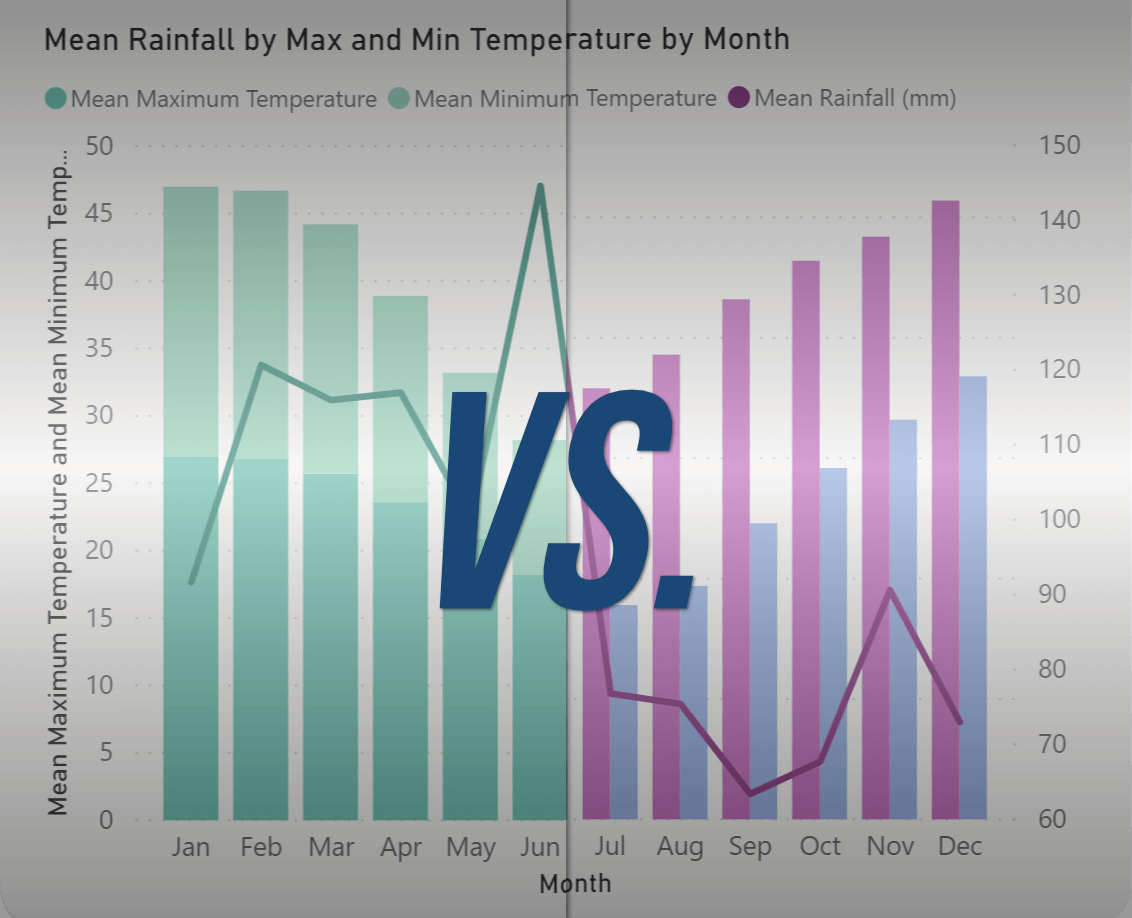
Line and Clustered Column Chart vs. Line and Stacked Column Chart
Dive into the key differences between Power BI's Line & Clustered Column and Line & Stacked Column charts. Understand their unique features, best use-cases, and tips for optimal data visualization. Make informed choices in your next Power BI report.

Unraveling Ribbon Charts: A Guide to Power BI's Powerful Visualization Tool
Unravel the power of Ribbon Charts in data visualization with our comprehensive guide. Explore their uses, best practices, and examples in diverse complexity levels, specifically focusing on their application in Microsoft Power BI. Unlock insights from your data like never before!

Creating Crayon NPR Look with RenderMan for Blender 24.4
The video below demonstrates my process of simulating a crayon look from a 3d animated scene.

Run Power BI On A Mac Like A Dev
Microsoft Power BI is the hottest Self-Service BI solution today. Unfortunately, it is a Windows-only application. If you are on a Mac there is an easy way to install and run Power BI without clogging your computer with extra software.

How to build a Power BI priority matrix for your JIRA boards
Do more than just Analytics with Microsoft Power BI and Atlassian JIRA, learn how to build your own priority matrix from JIRA Core projects and embed into your Business Intelligence dashboard.

Why you need a testing strategy for your app
You know about unit tests, users design tests, and continuous integration. But have you thought about how to conduct a field test for your app? This chap didn't, until he had to.

The Persona Brief
A persona is a fictional representation of the client type your business might attract. By creating your persona and understanding how it acts, you can communicate with your customers more effectively. It follows that your sales will benefit and your startup will grow.